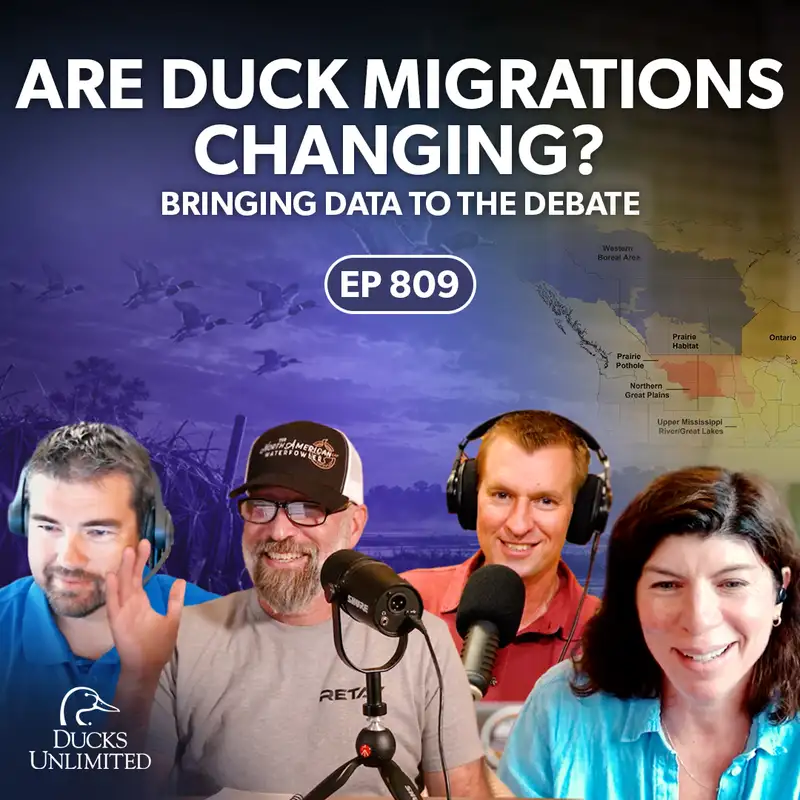
Are Duck Migrations Changing? Bringing Data to the Debate (Ep 809)
Right. Well, I'm really excited about this topic because amongst waterfowlers is the migration shifting is a common topic that you hear people discuss.
VO:The following episode of the DU Podcast features a video component. For the full experience, visit the Ducks Unlimited channel on YouTube. Subscribe and enjoy.
VO:You're tuned in to the Ducks Unlimited Podcast. Conserving wetlands, restoring habitat, and working to fill the skies with waterfowl today, tomorrow, and forever. From field tested insights to the biggest conservation wins across North America, this is your front row seat to wetlands conservation in action. The DU Podcast is proudly sponsored by Bird Dog Whiskey and Cocktails. Whether you're wrapping up a hunt with your best friend or kicking back with your crew, Bird Dog brings award winning flavor to every moment.
VO:Enjoy responsibly.
Elliot Snider:Hello, and welcome to the Ducks Unlimited North American Waterfowler Podcast Collaborative episode. I am here today with doctor Mike Brasher, doctor Heath Hagee, and doctor Lisa Webb. And the reason we're doing a collaboration on this is we are gonna be talking about the burhygien studies. I've had doctor Brasher on my pat my podcast over on the North American Waterfowler, and we decided this would be great to bring me in as kind of the host and helping these guys flow through the content of these studies. So how how's it going today, Mike?
Mike Brasher:It's good. It's great to be with you, Elliot. Appreciate you agreeing to this experiment, if you will. We've we've done a a co branded episode with a few, I think, once or twice before, but nothing really this technical, and I don't think with this many remote participants, so appreciate you being a guinea pig.
Elliot Snider:Yeah. I'm honored to be here with you guys. I've been looking forward to this for weeks. I'm just really excited to get into this.
Mike Brasher:Yeah. Well, and and we can do so. This is gonna go out on both of our platforms, and this is I think this is an interesting topic. I think people are interested in this, you know, the idea of changing distributions of ducks during winter and and causes for that. I think there are a lot of there are a lot of stories and and ideas and hypotheses of of what's going on, whether ducks are shifting their distribution, what's causing those those distributions to shift.
Mike Brasher:There have been some recent studies that have looked into various parts of that. We, the three of us here, have collaborated along with Doctor. Bram Verhagen, the lead author on the studies that we'll be talking about, a a a study that looked at band recovery distribution and actually wing recovery distributions as a way to index some of those changes, long term changes in duct distribution to the Mississippian Central Flyway, and so that's the that's what we're gonna be talking about today, and hope people will find it interesting. So I will kinda take the opportunity to introduce my colleagues here or sort of toss it to them, give them an opportunity to introduce themselves, and I'll start with doctor Lisa Webb, the first time ever on a podcast, which is super exciting.
Lisa Webb:We'll see. Yes. Hi. I'm Lisa Webb. I am with the USGS Cooperative Research Fish and Wildlife Program.
Lisa Webb:And at the time I did this research, I was a scientist for the co op unit program. So I worked with state and federal management agencies to help them answer questions that could inform research. And so that's how I got involved in this. I studied waterfowl and wetlands for oof. Guess I graduated with a PhD twenty years ago.
Lisa Webb:So for a while and have been doing science on on waterfowl and wetlands ever since. Last no. Two years ago, I took a job as a supervisor with the coop unit. So I'm transitioning out of doing the science and facilitating the science for lots of co op unit scientists across the Southeast US.
Mike Brasher:Thanks for that, Lisa. People that have listened to other episodes on the Ducks Unlimited Podcast might remember that we talked with some folks from the Bird Banding Lab. We've also talked with doctor Mike Brunge. Those those people there are also associated with the US Geological Survey. That is a federal, I guess, bureau, I'm not sure the correct title, within the Department of the Interior, sort of a sister agency of The US Fish And Wildlife Service.
Mike Brasher:They do a lot of science and have a lot of scientists scattered through all all across The US in different disciplines. Lisa, yours is really, really unique, and and well, the the no. I guess it still is. You're still in the cooperative co op unit, cooperative research unit, and we'd love an opportunity in the future to talk about that, to explain sort of that relationship, very unique relationship between the federal government and universities and, you know, state helping to address state and regional and national science needs. But anyway, I just wanted to kinda give a little bit more flavor there to the USGS element.
Mike Brasher:Now I'll go to Heath, Doctor. Heath Hagy, who is a repeat guest on our podcast, but he's he's changed jobs here, I guess, since you were previously on with us. So give us a reintroduction, Heath.
Heath Hagy:Yeah. Don't set expectations too high, Mike. We don't we we might not meet those. But, yeah, thanks to you, Mike. And, Elliot, thanks for hosting.
Heath Hagy:Appreciate this being on the DU Podcast, having an opportunity to chat with y'all today and talk about some of this research that was led by USGS and and some of Lisa's shop there. I work my name is Heath Hagey. I work for the National Wildlife Refuge System. I run the habitat and population evaluation team. We call it the HAPET office.
Heath Hagy:I'm based in Bismarck, North Dakota, and we serve sort of science, planning needs, data analysis, monitoring for the National Wildlife Refuge System in parts of Region 6, which is our Mountain Prairie region, and Region 3, which which is our Midwest Region, kind of that North Central portion of the of The US. We have the pleasure to work with USGS on a lot of projects. They help us with lots of science questions, and we work really closely with with Lisa and her shop for this one. We also work with Northern Prairie Wildlife Research Center in Jamestown on lots of lots of prairie prairie questions and prairie nesting ducks and other grass and bird projects. As Mike mentioned, I'm guess I'm I didn't do too badly before, so he invited me back for my former role.
Heath Hagy:I was the waterfowl ecologist for the Southeast Region for about six to seven years based in Memphis, Tennessee. So I've had some experience on both sides of the Mississippi And Central Flyaways doing waterfowl research, worrying about waterfowl distributions, and and trying to serve the needs of of of waterfowl hunters and other waterfowl enthusiasts throughout the Central And Mississippi Flyaways kinda north to south. So with that, thanks, Mike, and and, again, thanks, Elliot, for inviting me today.
Mike Brasher:Yeah. You bet. And, Elliot, I'm gonna turn this back over to you, but I'm gonna explain a little bit of what we're doing and the idea behind this cobranded episode. This is a it's a topic that's of of great interest to a lot of people, and, you know, for our audience here, we're primarily talking about our waterfowl hunter brethren, conservationists, not a lot of, I mean, it's not necessarily what you would think of as a scientific peer reviewed, you know, sort of audience, and so we know with that, as we've seen on, well, at least I've experienced on on social media, people are sort of skeptical, and that's a good thing. It's not you know, science is part about is partly about asking questions, well, it's a lot about asking questions and having a healthy dose of skepticism, but we wanted to bring you in as sort of the host of this to ask questions from sort of an independent party and to help us provide answers and talk about these questions from the standpoint that that's gonna connect better with the primary audience here, and also to reduce the probability that people accuse us of just putting out propaganda if it was just a Ducks Unlimited hosted episode on this.
Mike Brasher:But no, I say that kinda jokingly because we do, you know, have fun with that sometimes, but it's a serious question. It's one that we take a lot of pride in having an opportunity to help address. I know other colleagues of ours have addressed it as well in various ways, and we can talk about some of that and the way these studies were different, both from recent studies as well as others in the past. All of this, in I think our mind, is about providing credible information to the people that are interested in ducks and duck habitat, duck conservation, all of the things that connect with it. So I'm happy, honored to be part of team.
Mike Brasher:Bram was Doctor. Bram Verhagen was not able to join us, so the three of us will cover it. I'm gonna kick it back to you, Elliott, to ask the questions and kinda lead us through this, and we'll just have fun with it.
Elliot Snider:Right. Well, I'm really excited about this topic because amongst waterfowlers is the migration shifting is a common topic that you hear people discuss. And so to actually have some science behind it, I've already quoted this study on my own podcast many times, it's like it's just wonderful for the community to have this data. So it's the Verhagen study, there's actually two of them, and
Mike Brasher:they were back to back, Right, Mike? Yeah. We'll we'll kinda get into that, but it was a it was sort of a multi year research endeavor is probably the way to describe it. It was funded by a grant, and and we'll we'll talk about who that was. But this was this was sort of a two and a half to three year, you know, quest to to answer these answer the question fundamental question of, are duck distributions changing during fall and winter?
Mike Brasher:If so, to what extent? How does it vary among species? Do those distributions vary among different populations of ducks? Do they vary based on sort of month of during fall and winter? We and and whenever we set out to do this, you know, we we created a few very core objectives, which I sort of described generically described there.
Mike Brasher:Then another one another objective was to try to identify some of the factors that were responsible for changes. Should they be documented? And so we kinda went with went about this in sort of a linear process, was first ask the question of, are distributions of ducks during fall and winter changing, and are those are there differences in those patterns among species, populations, months of fall, winter, etcetera? And then once we got that answer, we wanted to move into the space of can we identify the factors that help explain those changes, if there are any? And if there aren't any changes, why not, and why might we see differences between species and and so forth?
Mike Brasher:So fundamentally about are duck distributions changing, to what extent, among what species, and why. And it took us I think we had Bram on this, working on this for, what was it, two and a half years, Lisa?
Lisa Webb:Maybe.
Mike Brasher:Yeah. I mean, like, as as a postdoctoral research associate under your direction at the University of Missouri, Brom is actually still working on this. He's got a we have a third manuscript that is still in development. It is currently undergoing review following the recent round of of peer review, so it's it's not actually over yet, Elliott. We're still working on this, and then once
Elliot Snider:And that one's focused a little more on causation. Correct?
Lisa Webb:That's right.
Mike Brasher:Yep. So that's kind of where we are with the So how,
Elliot Snider:when, and why did this study first emerge? What caused this to even be something a path you guys went down?
Mike Brasher:Lisa, we'll toss that. Other than us being crazy and, you know, and wanting to tackle because to be clear, this is a there is some I don't wanna say controversy, but there's some chatter around it, but I mean, don't think any of us were afraid of approaching those questions. It's actually a very appealing part of being a scientist, getting to try to answer some of these more challenging and intriguing and exciting, you know, questions. So, Lisa, how did all this come about?
Lisa Webb:Yeah. Guess I'll just preface that with I got into this field to study things that people cared about, and I have not encountered much that people care more about change our duck distributions changing. So this was a mildly intimidating and and fun question to to address. But I think what kicked off this project was the or conversations around this topic was the poor hunting season of 2018 that led to a lot of conversations on whether it was just an anomaly of a poor weather year or if it was a broader signal of trends that were emerging throughout the Mississippi Flyway. So especially among waterfowl biologists in the Mississippi Flyway, the tech committee section of the Mississippi Flyway, that meeting or that winter meeting after that duck season, you know, this is what people were talking about.
Lisa Webb:This is what people had questions on. And we actually worked to or a group of us organized. It was Nikki Heitmeyer. Mike was involved. Luke Mailer, Andy Radicke, Dale Humberg, Green Mengel, and Tom Mormon organized a workshop at the Mississippi Flyway Tech Committee section to discuss distribution dynamics of of winter waterfowl and and weather patterns changing in the twenty first century.
Lisa Webb:So lots of lots of conversations, lots of unanswered questions, a few hypotheses were were tossed out, but still a real need for are they changing? And then if so, what might be contributing to it? We had a follow-up meeting, and I think in spring of twenty nineteen, Mike and Heath, that was the one you all helped organize with Andy and Andy Radigy of Missouri Department of Conservation in the Bootheel Of Missouri. Got a a group of us together, and we worked to identify some some key uncertainties and also some potential next steps in addressing these uncertainties. So refining some of these broad questions into uncertainties that that were perhaps testable in terms of objectives and hypotheses and then kind of deciding to keep talking, looking for opportunities to to do research that might address these questions.
Lisa Webb:And then from there, well, I can stop talking. That's why. This is a long way of saying these these conversations and questions have been swirling at least for for a long time. And it you know, we cut yeah. Fall was twenty twenty eighteen, 2019.
Mike Brasher:Yeah. And and, Lisa, one thing that I would add there, you know, you reminded me there were some of your final comments. You can go back through old literature, and this question of are duck distributions changing has been around, I mean, as long as we have as long as we have been hunting ducks, people have asked this question. You can go back to publications in the thirties, forties, fifties that will have this very same question laid out, the very same hypotheses, the very same finger pointing. Duck hunters, duck managers have always cared about this question, and so this ours was I think there was some work in the early two thousands that began to look into this.
Mike Brasher:It was sort of a recent effort to look into it, and then and then what you're seeing now, or at least in the past few years, was the next version of of trying to address that question.
VO:Welcome to the Old Timer Minute, sponsored by Old Timer Knives.
OTM:The funniest thing I've seen a hunting dog do I mean, obviously, there's those moments where you get get somebody that's you know, you're telling your dog to do something. They're completely ignoring you, and you're like, yeah. I trained that dog myself. But aside from that, there's always the the comical moment, especially if you hunt in in timber or in somewhere you're driving a boat a long ways. Sometimes dogs gotta go, and sometimes they can't make it out of the boat.
OTM:So I've I've watched a a hunting dog take a number two in somebody's basically, right on top of somebody's blind bag, and that was quite entertaining for the rest of the day. That guy got some some grief, and the the dog owner got quite a bit of grief out of that too. That's your Old Timer Minute brought to you by Old Timer, built for generations.
VO:Visit the oldtimer.com.
Elliot Snider:So I'm curious as a as a non scientist, how does when an idea emerges like this, how does it actually go from being an idea to something that's actually being conducted? What are what are how do those steps look like, and how long does that process take?
Mike Brasher:Heath, you wanna take that? Sure.
Heath Hagy:I can I can start it, and then we can tag team? One thing that that works pretty well is just trying to get our arms around the problem or the question. Right? So, you know, we're saying, hey. There was a question out here.
Heath Hagy:There was a problem. Actually, there were many different questions, many different problems, and it depended on who you who you talk to. Are you talking to the duck hunting community? Are you talking to state state waterfowl biologist? Are you talking to professional USGS scientists?
Heath Hagy:Everyone is framing that up a little bit differently with different technical expertise. And so part of the original scoping conversations and you can you can see that this was a multiyear process of just getting our arms around the problem. We were trying to figure out which problem we were gonna be able to tackle, what datasets were available, and, honestly, how much resources it would take. You know, sometimes you scope out a problem and it's and we, you know, we have to sort of look at it and say, gosh. That's too big for us to tackle with the resources we have, or we just don't have the data.
Heath Hagy:Unfortunately, even though we have wonderful monitoring data for for waterfowl in North America, we we don't you know, it's not it's not perfect. It's not a perfect dataset, and it doesn't lend itself to all questions perfectly. So part of the initial, you know, conversations was what data sources do we have looking around at the band data, at the park collection survey data, at the breeding population, the May survey data, and some other data sources, winter banding data. What do we have? What's available?
Heath Hagy:What are the biases of each one of those datasets? And can we use some of those to tackle this this this this project? And if so, frankly, how much is it gonna cost? Do we have the right people involved? And just getting our arms around some of those things because the last thing that we wanted to do is dive in and sort of do a bad job or or poorly answer this question and potentially lead to more uncertainty, you know, for the hunting community, for the waterfowlers than when we stepped into this.
Heath Hagy:And so at least from my perspective, I think getting our arms around it in those in that flyaway discussion in that in that that secondary workshop that took place in Southeast Missouri, that was super important so we could scope out what it was gonna take to do a really good job answering this question. And then Lisa was I'll probably kick it over to here to you, Lisa. Lisa was fundamental in in in writing a grant, working, looking for funding, trying to figure out what it was going to take to really do this project well.
Elliot Snider:Well, I always want to talk more about the funding. I don't is this something when you're talking a grant, all these studies are funded by the government? How do you decide, What are the options to where funding for something like this comes from?
Lisa Webb:A lot of it comes down to once you have the the questions or or the objectives that you think you'd like to address, looking for an agency who's put out a request for proposals to to fund research, what where their priorities and what they're interested in funding aligns with the questions you're trying to ask. And so sometimes you can have great questions, but if no funding agency has has that as a priority to to fund research on, it just sort of sits there until you can either find or or convince someone that it's a question worth asking. In this case
Elliot Snider:When you say agencies, what do you mean by agent? Are you talking governmental agencies, or are there any private?
Lisa Webb:That's primarily who I've worked with to to fund research is the state natural resource agencies, federal natural resource agencies, some nonprofits, but we tend to stick with with those three as as the primary funding source.
Mike Brasher:Yeah. Elliot, we do have a number of options. Lisa's right. The the state agencies, public funding sources are a big part of of a lot of the studies that we have been associated with, but but Ducks Unlimited also has some opportunities to do fundraising with foundations, private foundations. We also have opportunities to reach out to sort of major donors, philanthropists that may be interested in funding certain research projects.
Mike Brasher:This one wasn't necessarily that case, but I think most people don't understand the challenges that, and the difficulty of getting the funding required to do studies like this, or any kind of research study. There is no shortage of ideas among waterfowl scientists or any kind of scientists on what we would love to answer, what kind of question we would love to try to answer. There's no shortage of ideas, and there's no shortage of proposal writing. There is a shortage of funding, and we look at a lot of different areas, again, public, private, NGO, philanthropy, foundations. It's a combination of sources and what funds a given project just sort of depends on the nature of, as Lisa said, the topic and who you can reach out to and how good you are at grant writing.
Mike Brasher:There's not necessarily a clear recipe other than it takes dogged determination and effective writing to ultimately land the funding to do a study like this or or any other.
Elliot Snider:Why did you guys feel this topic was something that really needed to be addressed? Is it was it because just all of the chatter, or have there been other studies in the past that have kind of led to what brought you guys to decide this was needed?
Mike Brasher:Because Lisa had a crazy idea to do so.
Lisa Webb:I have more than one crazy idea, but but this one in particular led to the project.
Mike Brasher:Yeah. I mean, that's so the I'm gonna toss it back to you here in a minute, Lisa, but I do wanna give you credit for this because that's the way a lot of this works, is that sometimes, well, a lot of times, these proposals, these ideas are well, somebody has to lead it. You know? Somebody has to come up with the original idea, the initial idea, and they have to make the commitment to use their time to lead the effort, to pull together a coalition of partners, to lead the grant writing, to lead the searching for different funding sources, and in this case, I attribute that to Lisa as having this idea and saying, I want to answer this question. I want you guys to be part of it.
Mike Brasher:So it was Lisa, Heath, and I to begin with, but we were not independent in that because we were working closely with and talking with and trying to address the needs questions that we were hearing from our partners in state and federal agencies through the Flyway Council and tech section meetings, but it takes an individual to sort of be the champion for an idea, and that was Lisa that sort of took the chart took took the bull by the horns. And and so, yeah, Lisa, why did you why were you so crazy to to rope us into this?
Lisa Webb:Because you seemed equally crazy.
Mike Brasher:True.
Lisa Webb:Again, we had identified these uncertainties and seems like there was a real interest and need for managers to to have information to know if distributions were changing. If so, to where and how much and in in what month so that this is all information that would be useful in making these management and conservation decisions. And so I think it was in early twenty twenty, we saw a request for proposals came out. So inviting competitive proposals to a funding agency. In that case, it was the USGS Climate Adaptation Science Centers.
Lisa Webb:And so, you know, submit a two page proposal, initial proposal on on the topic that you'd like to study. And and this happened to align with or our questions happen to align with the funding agency's priorities. And, yeah, I wrote Mike and Heath into onto the team, and and we work to to kinda translate the uncertainties identified by the managers into both research questions and objectives and also just testable hypotheses in that. Because you can have a lot of questions, but if you don't have that identified the data that you can use to test hypotheses, then then it's it's just gonna remain a question. So we submitted along with, I think, a lot of other people.
Lisa Webb:I think they said they had over a 100 proposals submitted and pre proposal submitted. We submitted a proposal to the USGS Climate Adaptation Science Center, and then they invited us to do a full proposal or submit a full proposal so that we really flesh out the details of what we're what the objectives are, how we will approach methods we'll use to accomplish those objectives. And we also had a few letters of support quite a few letters of support from the management and conservation community in the form of the Mississippi Flyway, the Central Flyway, multiple joint ventures, all wrote letters of support for this research and and talked about the importance and the need to to have the information to either make better decisions or just to to communicate to their constituents what what's going on in terms of winter distributions for waterfowl. So, ultimately, I think this was spring of twenty twenty. It was selected for funding, and and so then we we moved into all the actually doing the project there.
Elliot Snider:I think it'd probably be a good time to just give a summary of the findings and the discoveries, and then after that go and kind of dig into the specific details of it.
Mike Brasher:So high level, Elliot, what we found from this study is that duck distributions during winter, as indexed by harvest, that's an important part, should say, that we use data collected from harvest as an index to distribution of ducks during winter. So technically, what we were measuring were changes in duck harvest and duck harvest distribution. But there is reason to believe that that is a pretty good proxy for the actual distribution of ducks in space and time during that fallwinter period. So if I use those or we use those terms interchangeably, duck harvest versus duck distribution, you know, just kinda kinda bear with us. That's sort of the assumption that we're we're making.
Mike Brasher:The high level sort of take home is that we did document changes in distributions of duck harvest during fall and winter. Though the degree of change and the direction of change varied based on species, It based on it it varied based on the month of of fall and during fall and winter. It varied based on which subpopulation of of which breeding subpopulation of bird, yeah, that you we're we're talking about. A lot of that variation was attributable to differences in the life history of the birds, how these species are different. They're I mean, that's kind the high level view.
Mike Brasher:There were changes, and generally, changes were in a northward direction. For some species, those northward movements or shifts were a bit more noticeable, and there were several different ways that we tried to measure that, tried to characterize the distribution of ducks during winter, and we'll talk about some of those, but one of it you could think about is like, okay, every band recovery, every wing recovery has a location tied to it. You can calculate the average recovery location across all the the those data points of interest, and you can kinda get what is the centroid of recovery for a given species and time, etcetera. You can also look at the entire spread of those recoveries and kinda get a more a broader spatial depiction of that recovery across time periods. The time periods that we're talking about here, it's between 1960 and 2019.
Mike Brasher:And so we did that as well. We looked at how the overall distribution, the overall area of of various metrics of of of recoveries or distributions changed. We looked at whether the the northward edge of that the the degree to which that the northward edge changed, the degree to which the southern edge changed. We kinda looked at all these these different metrics associated with characterizing the distribution. So when we came out with the results in a Ducks Unlimited popular article a couple of years ago, I remember seeing some comments.
Mike Brasher:Of It's like, gee, thanks for telling us what we already knew, and that's a fair. Duck distributions are changing, and they're migrating They're not migrating as far south for some species. And so that's a fair criticism, but again, this is the way sort of the scientific process works, the scientific community works, and, you know, it it's it takes time, as we've kinda described, from when this idea was first conceived to when we got the first publication was probably four years, and that's just the way the scientific process has to work, and so yeah, that's the high level overview.
Elliot Snider:Well, and when when you say thanks for telling us what we already knew, I'm very skeptical when I hear people saying, oh, I know this because last season I saw I mean and I think one peep one thing that people don't understand is that the massive scale of North America and what you're seeing with your own eyes is, yeah, it's rely I mean, you can put that into the dataset, but it's such a small sample of the whole scale that we just because you see it with your eyes, to actually have a study that uses the scientific method and data to tell us that it's true to me makes a big difference. I put because there are times throughout hunting where people are like, I had the worst year, I haven't seen any ducks in my whole group. We had the best year, and we saw plenty of ducks. It's so situational. So that's what I love about the study.
Elliot Snider:It's like, yeah, we had an idea this was taking place, but, you know, when you're breaking down different species and using data from 1960, to me, it was extremely, extremely meaningful for that reason. Do we want to go into the different species? And where do you want to go with this, Mike, as far as what we talk about next? Because I know we can break it down to mallards, pintails, blue wings. Where do you think is the most valuable place to go next?
Mike Brasher:Well, I'll just comment on something that you said there, and I appreciate that you did so. It's like I have I hear those stories also of somebody telling me that their hunting today is is was the or last year was the worst ever, or that they've seen a, I don't know, 50% decline in the number of mallards they're shooting on their property, and they want to extrapolate or have the tendency to extrapolate that to the entire geography, the entire country, entire flyway, I've kind of taken the position that I'm never gonna tell someone that the observations they're making on their particular hunting spot or their particular property are wrong. I will take them at face value that what they are observing is within some degree of measurement actually what's happening there. But that doesn't mean it's representative of what's happening across the entire state, the entire county, the entire flyway, certainly the entire country. And so to your point, Elliott, that's what this project was about, is collecting the data or using the data.
Mike Brasher:The data was already collected as a result of the incredible participation by waterfowl hunters for many, many decades in reporting their harvested bands and participating in harvest surveys, we used that data and assembled it at the appropriate scale, and then we kind of partitioned that and conducted the analysis in a way that would allow us to answer questions a little bit different than what had been done before to try to get a little bit more precise with our understanding of the degree to which any of these changes may be occurring. And so probably what I would say, maybe something to talk about is sort of to draw out how this was different from maybe one of the more recent studies, early 2000s, Green and Cremence, a study they conducted looking at shifting distributions of Mallards, and they didn't find much of a change at that time, but they didn't break it down by individual month. They just looked at the overall distribution during the fall and winter period. And so
Elliot Snider:year was that? I'm sorry. What year was that that that came out?
Mike Brasher:Lisa Heath. Do y'all remember all that?
Lisa Webb:Thousand eight. 2008. Yeah. So I think they looked at a a smaller time frame, like mid nineties to early two thousands.
Heath Hagy:And I'll just add really quick too that we had the the green green increment study. We also had a number of agencies who had data, and we were seeing signals too. But we were looking for that additional level of rigor from from this project and appropriate scale, like Mike mentioned, that was perfect. So the appropriate scale to really answer that question is not in an individual hunt club. It's not an individual national wildlife refuge or complex.
Heath Hagy:It's it's at a much larger scale so we can really understand it. We had we had pretty rigorous data on some local scales where we were seeing these speed you know, these trends, for some species. So this project was not about just being, just addressing concerns of hunters. That was a major part of the genesis of this project, but we were also responsive to state agencies and the signals that they were that they were seeing in some of their midwinter survey data or their, biweekly survey data on their, you know, for state agency on their WMAs. We were seeing these signals in different ways in different places, primarily in the South, and so we were being responsive to collectively all of those needs for this for this information.
Heath Hagy:I just wanted to sort of throw that out there as well.
Mike Brasher:Elliot, you asked a question of where we wanna go next with this. I think what we wanna do is is spend a little bit of time on that first study, the one in which we looked at at at sorta overall patterns of of winter distribution or winter harvest distribution for 15 species of of ducks. That's sorta the first cut that we took in looking at this. We wanted to see how many different species we had sufficient band recovery and wing recovery or wing submission data for and just look at these broad patterns. So, I mean, Heath or Lisa, which one of you I mean, Elliot, if you're okay with that, I think it'd be useful to touch on that a little bit.
Mike Brasher:Let's do it. Do have some maps that I wanna show a little bit later on for this study that I think has gotten a little bit more attention. I will also take the opportunity right now to say that it's kind of funny, Facebook world, everybody refers to these studies, especially the one where I'm gonna show some graphics, as the Ducks Unlimited study. It wasn't a Ducks Unlimited study, it should have rightly been called the USGS study because they were the ones that led it. There was only one Ducks Unlimited person involved with it, and that was me, and I certainly didn't lead any of this, I just kinda contributed to some of the review and thought and so forth.
Mike Brasher:But anyway, appreciate the brand recognition, everybody, that calls it the Ducks Unlimited study, but should rightly be the US Geological Survey. So I'm sure we'll have an opportunity to come back to that. So Lisa or Heath, whichever you wants to kinda take the lead on that, the the first study, kinda summarizing it.
Lisa Webb:Okay. So Mike mentioned, you know, a lot of we hear a lot of hunters talking about ducks are are shifting. Migration is stopping or shifting. And this was an attempt to to answer that question to find out if that's the case, if distributions are changing, but to really add some detail to it. If it's shifting, how much is it shifting?
Lisa Webb:What for what species? To what extent? Like, how far north or or in any direction are they going? And then what time of year? Is it is it persistent shift, or is it low you know, primarily in one month?
Lisa Webb:And so we really wanted to design a study that would add details to and and flesh out details to this question. And so we relied on oh gosh. I think it was, like, 450,000 band recoveries from 1960 to 2019 for 15 different species and 2,000,000 or over 2,000,000 wing recoveries. And we looked at the change in latitude, average latitude, and longitude for each of these species. That was it was kind of we took we started with a really broad species approach and very general, is it latitude or longitude that's changing?
Lisa Webb:And we found that in general, they are. Distribution harvest distributions are changing, but it's really complicated and complex. I mean, start digging into the details. It's challenging to to draw some generalities, but I'll try. Some of the key takeaways from that were that there's some subtle, but purse and subtle on an annual basis, but persistent over this sixty year time period shifts in latitude that vary by both species and by month.
Lisa Webb:And we didn't see any consistent trends in in longitude. So of the species we looked at, if they are shifting, it seems to be predominantly in latitude.
Elliot Snider:So they weren't going as far south. Yeah. Yeah. They're ending their migration farther north.
Lisa Webb:But it differs depending on on which month you look at. And this is where really being able to tease out the distributions in October, separate from November, separate from December and January, allowed us to see patterns that previous studies hadn't detected. So we we found that the dabbling ducks in general were shifting south in October and November, and then they were shifting their distributions were shifting north from what they were historically in December and January.
Elliot Snider:So they're actually getting farther south in October, November than than in the past?
Lisa Webb:Yes. The latitude. And and and then farther north in December and January. And so if we had just looked at all of those data without separating it by month, it probably would have averaged out, and we wouldn't see have seen a trend. But by being able to look at it separately by month, we were able to tease out those distinct temporal patterns in changes in distribution.
Elliot Snider:And could could could you find out how much farther south in October and November? Like, how large of a scale is that?
Lisa Webb:For dabbling ducks, yeah, dabbling ducks, they this is the individual species, but over the entire like, if you combine all dabbling ducks, they shifted between 16 and a 185 miles south in either October, November. And then in December and January, they shifted between 90 and a 186 miles north.
Mike Brasher:So, Elliot, I have this graph up here, one of the charts from that paper, if you wanted to kinda look at it. It it tries to depict what it is that that Lisa's describing there. It takes a bit to to, you know, stare at and and figure out here, but on the left side of it, you've got abbreviations for individual species, and and so then as you work your way across left to right of that chart, you have those lines, four lines, each corresponding to the the change in latitude, north south change for each of those months. And so if the the line, the dashed line represents no change over that sixty year period, Red to the left side of that line represents a southward movement as or I shouldn't say movement, but change, as Lisa described. And then if it's to the right, the marker is is black there, and it indicates a a northward change in in those distributions.
Mike Brasher:And some of that is, you know, maybe difficult to explain the October, November southward changes. And and, you know, sometimes I I can't remember, Lisa, Heath, what we ultimately sort of opine might be going on there. We tried to correct or adjust for differences in hunting season date. Those have changed a lot over that sixty year period. We went through some very extensive and quite complicated procedures to try to adjust for that.
Mike Brasher:That is another unique thing about this study that no one had previously tried to do, is sort of adjust for the changes in hunting season dates. I know that we'll ever get perfect with that, again, because this technically represents a change in harvest and not exactly a change in the distribution of the birds themselves, so if a hunting season is closed at a given period of time during a given month, then we do not have the potential to quote sample birds from that geography, from that area, for that time period. So there are, as Heath referenced this earlier, there are some limitations with all of these data sets, but we took some steps to try to address those. So I think our view on this is that if the signal is large enough, if the true change is large enough and we take these steps, try to adjust for some of the known limitations of the datasets, then that signal should come through, and I think that's what we are seeing with some of these. Certainly, you know, December, January, that's the dominant signal that a lot of people would say, yeah, I expected that, And you can kinda look at these on a species by species basis and convince yourself that you can explain it here or there, but I don't think any of us are gonna sit here and tell you that we know exactly why these differences existed or how to explain each of these differences or each of these data points for each species.
Mike Brasher:Blue wing is one interesting is an interesting one here, and we can kinda look at it and and see if we can make up a story around what's going on here. So sixty year change in latitude from bands. You see you have two different symbols there. One is a circle and one is a square. The circle corresponds to the data that you and and the results that we get from band recoveries.
Mike Brasher:The square corresponds to wing recoveries, and so for October, we see a significant southward change in distribution technically harvest. Lisa and Heath, do we think that is related to changes in hunting season that we weren't fully able to adjust for? Or I mean, because I don't Or was there a change over years? I have a difficult I have difficulty kinda recalling exactly on that one, but that's a result that really stands out.
Heath Hagy:Are you asking us to go into speculation land? I'll do it very I
Mike Brasher:couldn't remember if we had a good explanation for that. And and sometimes you don't have a good explanation for what you see in the results, and it leads to additional questions, and that's okay.
Heath Hagy:Yep. I'll fall on the sword a little bit and then see if, Lisa can can clean it up. There are some changes in seasons. We did our best to try to account for that information. I think we also have some true distribution changes in species.
Heath Hagy:We have, different population levels. Right? Of blue wingtills, they're breeding populations, we think, have changed dramatically over portions of this time and probably their wintering range and how far south they're going, how how how what proportion of that of those birds are being seen and harvested in The The US as opposed to to going somewhere further south. And so there are lots of different things. I think spoiler alert a little bit.
Heath Hagy:We're probably in a in a few minutes get to that get to that third manuscript, that product of of Brahms, and and we can discuss some of the some of the mechanisms why. But probably not one thing, unfortunately. We probably have some potential changes in in harvest regulations where we might see a signal in the harvest data, of course, because they're, of course, related, and we couldn't account for that perfectly. We also have some true changes in distribution, whether that be related to weather or things changing in their core wintering range outside The US and even have it and even habitat here with different water regimes in in southerly areas, changes with coastal marshes, so on and so forth. So lots of different things.
Heath Hagy:I suspect there's some there's some it's very complicated, as you said earlier, and there are some there's probably some very some some truth in there, right, that it that we are seeing some of that, and then other things is probably related a little bit to to changes in harvest and harvest distribution as well that we can't fully explain.
Mike Brasher:Did you get all that, Elliot? It's perfectly
Elliot Snider:I did. Clear, Yeah. So I I don't want to spend I don't want to spend a lot a lot of time on this, but I'm sure there's some people that are like, wing recovery? I understand band data, but, like, real quickly, wing recovery. That's that's personal people samples sending in?
Mike Brasher:That's right. That's what we call the parch collection survey or the wing bee. Some people may have heard heard it referred to. Each year, the US Fish and Wildlife Service conducts two surveys, harvest surveys, to get an idea to estimate total harvest by species across state and flyaway and the entire country. Those two surveys are what they refer to as their diary survey, where they ask people just to keep track of the number of days they hunt, which days they hunt, how many ducks they harvest, how many geese they harvest.
Mike Brasher:They're not asked to differentiate species in that particular survey. Then there's other people. Some people are selected for both of these, but an another set of people are asked to participate in the parts collection survey where you're asked to send in a wing from each duck that you harvest, and for geese, I believe you're asked to send in tails or tail parts. Those wings then go to in storage as they come in in the mail, and then they go into storage for a few months, and then in the spring, biologists descend on a location in each of the four flyways where they get together and go through each of these wings to identify them by species, age, and sex each wing has with its corresponding data on where it was harvested, the date of harvest, I think it's the date of harvest is included in that, and so those two data sets, the diary survey and parts collection survey, are used in combination to estimate total the total and species specific harvest, but that's what the wing recovery corresponds to, are those wings that hunters submit through the parts collection survey.
Elliot Snider:And is that also where they get the data for harvested by state per year from those collections?
Mike Brasher:It is. It is. Those two datasets. Yeah. Another I don't know.
Mike Brasher:I'll take the opportunity to clarify it. Whenever you get your harvest information program registration at a point of sale or online and they ask you how many birds you harvested last year, that is not how we estimate harvest. Those numbers are not used to estimate harvest. When you answer those questions, that puts you in one of three or four different bins based on sort of intensity of harvest. Typical assuming that your harvest last year is a good representation or decent representation of what your harvest is likely to be this coming year in terms of those broad categories.
Mike Brasher:Very little harvest, medium harvest, and high harvest. That's important because those surveys are statistically designed and they want to sample individuals, hunters, in those different harvest intensity categories at different rates. That they had questions that you answer when getting your hip registration is part of the sample frame construction, not the harvest estimation itself.
VO:Stay tuned to the Ducks Unlimited Podcast sponsored by Bird Dog Whiskey after these messages.
Elliot Snider:So the first study was 15 species of ducks, and then the second one, you narrowed it down to mallards, pintails, and blue wings.
Mike Brasher:Right? Yeah. That's right. This is the one where we caught a little bit of misinterpretation on the impetus for this particular publication that came out. This is what led to that little exchange between me and some other folks on Facebook trying to clarify how this came about.
Mike Brasher:Say I'll it. The accusation was that we conducted this particular study on these three species using sixty years of data in response to the publication from our colleagues in Canada. And of course, that was patently false as we have described. We were starting down this road to answer these questions as early as 2018 and 2019, and another little unknown fact is that whenever we heard that our colleagues in Canada were going down a similar path, we set up a call to to get on the same page or understand what they were doing, what the to identify the differences in our studies, to see if we could complement one another in in any way, and and to so we weren't completely duplicating effort. And so they just they were a little bit ahead of us on the the the analysis and publication, and good for them.
Mike Brasher:It's a great study. It's very similar. There were some key differences though, but the idea that we responded to the results of that study and then put this one out again, patently false, and then the other bizarre thing is people claim that we arrived at different conclusions, which again, not true at all. Happy to go through this particular study, which is really, really cool. And those three species were chosen, Mallards, Pintails, and Blue Wings, because they are the ones for which we have more robust band recovery data, and sample size in a study like this is everything.
Mike Brasher:Your ability to identify patterns at certain scales of space and time depends on having a very healthy dataset, and there aren't very many species for which we just have tons of of band recovery. So that's why both studies chose those three species.
Elliot Snider:Well, can you clarify on the on the study in Canada? The claim was you were trying to disprove their findings?
Mike Brasher:I mean, I guess. You'd have to
Elliot Snider:What were the findings? What were the what were the the findings of theirs and yours was very similar, though.
Mike Brasher:Right? They were exactly the same. Exactly the same. Like, the key
Elliot Snider:Essentially, Ducks Unlimited is invested in proving this idea wrong that the migration isn't going as far south?
Mike Brasher:No. It was I I think they latched on to some reading of these papers, which, again, was an incorrect reading. They somehow read them to try to say that and, again, I'm anything that I say is is totally on me. I don't wanna I don't wanna this is sort of a disclaimer. I'm not My views are not necessarily representative of those of Heath or Lisa or their agencies.
Mike Brasher:That's what I'm trying to say.
Elliot Snider:I saw him getting nervous, so I'm glad you said that.
Mike Brasher:So there were some people that read these two studies as suggesting that the causes of these of these changes in winter distribution were different. There are some that that you know, some read it as though our Canadian counterparts pointed the the the primary causal factor at at changes in agriculture, and and we were pointing the primary identifying the primary causal factor as changes in climate and changes in weather. And again, it really frustrating to me, Elliott, when I saw that, because number one, neither study did a formal evaluation of the causal mechanisms for the changes. Neither study did that. Each of the studies offered some plausible hypotheses when you get to the discussion stage as what might be explaining the observed changes in those distributions.
Mike Brasher:Both studies documented northward shifts in the distribution of Mallards and pintails. Both failed to document substantial changes in blue wing teal. Both studies, if you look at it objectively, identified potential changes in agriculture and other elements of of land use along with climate as being possible causes of those changes. The difference, one of the key differences between the studies, was that the the our our Canadian colleagues restricted their analysis to only birds that were banded in the Canadian prairie pothole region. Our analysis included birds that were banded from those three species in The US prairies, Canadian prairies, Western Boreal forests, Great Lakes, and then Ontario, and we partitioned those out into different subpopulations, if you will, breeding subpopulations.
Mike Brasher:And if you look closely at the subpopulation from our study that most closely matched Cox et al, our Canadian counterparts, the results were very, very similar, and that's a great thing. That's part of science, replication, and finding similar results is a great thing. That's the way it's supposed to work, and I mean, I think they would say the same thing and and are appreciative of the additional attention focused on this, and so it's yeah. It was a good deal.
Lisa Webb:There's one thing I wanna highlight from the the study with 15 species that I think is, in my mind, the most interesting finding. We had an opportunity to look at the pace of distribution change and and whether it was, you know, one time period or or whether it was consistent over the entire sixty year period. So we were able to compare the the distribution change by decade, you know, sixty to seventy all the way through. And what we found was that for most of the species we looked at, there was a constant pace in distribution shift. So it wasn't just we can isolate it to this ten year time period is when things really move south or move north.
Lisa Webb:It was consistent across sixty years, and I think that is informative and helped us get to the idea of of some of the things we could look at to explain the mechanisms that are causing these shifts.
Elliot Snider:I'm glad you brought that up. That's that's a mass do you actually have a chart for that, Mike, that shows that by chance?
Mike Brasher:Probably. Actually trying to find
Elliot Snider:a huge difference in my mind to causation. There
Mike Brasher:it is.
Elliot Snider:Yeah. That's that's extremely interesting. And that is is that across all 50 or most 15 species?
Lisa Webb:I think we did it we we we grouped it by dabbling ducks and diving ducks.
Mike Brasher:Okay. So we still have October, November, December, January on the, you know, in kind of the column, if you will. Yeah. You're right, Lisa. We did lump it by dabblers and divers.
Mike Brasher:You again see the circles representing data or results from band recoveries and squares representing results from the wing submissions, decades here along the left axis, nineteen seventies up up top, 20 tens down on the bottom, and then if the markers are on the left side, that means that the change in latitude has decreased, which which what? Means that it's a
Lisa Webb:Moving south.
Mike Brasher:Moving south. Okay. That's right. And then over here in December December and January, we see more northward shifts for all of those species again. So there and then the farther to the right, the stronger the decadal change.
Mike Brasher:Right? So
Elliot Snider:Now in November, it looks like it's actually regressed a little bit over time, the change. Right? Am I reading that right from seventies, eighties, nineties that the changes become less?
Lisa Webb:I think it just gets more variable in terms of, like, one year, one decade, it was moved really far south, and then the next decade, maybe it didn't move as far south. Or the open circles are the bands, and then the squares are the wings. So it can also vary based on the data source that we used.
Mike Brasher:So the the bars around here indicate the amount of variation that's associated with that. And so although you could draw a line through there to show sort of a a modestly increasing trend there beginning in the, I guess, from the the eighties, nineties, then yeah. I guess that's what you you know, if you drew this line, you show a well, except for something kinda going on there, you you end up sort of drawing a a straight line, which would indicate that it is a consistent, gradual sort of sort of change there.
Elliot Snider:It is so hard for me not to start talking causation. I'm trying I'm trying not to because the fact that it's the same between divers and dabblers would have a huge impact because their diet is so different. And the fact you'd see that the same basic pattern between them, in my mind, would rule out would make it less likely for it to be diet related, I would think.
Mike Brasher:Yeah. Which has I'm still staring. I'm staring at this again. It's the first time I've looked at this graph in a while.
Elliot Snider:Yeah. I know. We gotta be careful. We're doing a podcast. We're all sitting there staring quietly at the job.
Mike Brasher:Yeah. That's right. So but, yeah, the bottom line is that Lisa is pointing out is these have been kinda gradual. There's not a huge jump from one decade to the next. It's just these things are sorta when you line up the correct ones that you're comparing, these things are just, it's sort of a consistent gradual trend over over time there.
Heath Hagy:And I know I know people don't wanna hear that it depends and it's complicated, so we're we're trying not to say that over and over and over again. But you can see you could see in that in in those graphs how if you only took the last twenty years, you know, and you only looked at data from December and January, you'd be like, It's super clear. There's this big change. But if you look if you look at the large scale over time and space and account for changes in hunting season, different species, it it it's not this massive shift very quickly that that is perceived. In some locations, sure.
Heath Hagy:And we can talk more about the nuances of that, the same way that the the Cox paper pointed that out, that if you're on some the edge of these distributions, you're going to see a bigger shift. But at this large scale, there there there we we just don't get the signal that there are these massive fundamental changes, north and south, east and west, so on and so forth. Yes. There are some trends, and and we acknowledge that. We point that out, and they're interesting, and we'll probably get to some potential mechanisms of cause in a minute.
Heath Hagy:But that's the point of of looking at this and trying to do what we said earlier, really get an appropriate scale to to tackle this question really well so that we don't come up with a a with a cause and even complicate this really complicated messaging any more than possible.
Mike Brasher:Elliot, where do you want to go now?
Elliot Snider:Well, I I would like to go and then to the Besides causation. Yeah. I I I would love to I've got things in my mind about causation. I'm just like, alright. You can't just you can't just but I I I think it's to go into the individual species from the second study, I think, would be really interesting.
Mike Brasher:Okay. We can do that. We can
Elliot Snider:do that.
Mike Brasher:Heath, Lisa, do y'all wanna give any kind of additional orientation to that?
Lisa Webb:Okay. So the first study was looking at long term trends in in latitude and longitude for 15 species. And then the second objective was their study was to look at narrow it down and see which species we had enough data to not just look at latitude and longitude, but the extent of their distributions, the polygons that characterize where they were in 1960 versus now. And so that helps us quantify and map the in interannual variation, the changes over time, not just in the lat longs, but the shape and where they are and where they aren't anymore. And so this helped us quantify changes, but the boundaries and the shapes of where the species are and how it's changed over sixty years.
Lisa Webb:And I think we originally proposed to do this analysis for several waterfowl species. We didn't kinda left it open just we need to dig into the data to see which species had enough of a sample size because this analysis requires a much more it's it's very data hungry and data driven, and it needs a lot of data points to really make it a a rigorous finding or study. And so we found, I think, bluing teal, mallards, and northern pintail were the species that had sufficient data points in terms of band recoveries for to do this analysis. And we thought I mean, that was good. It but it also represented species along a gradient of perhaps how fixed their migration was versus how flexible.
Lisa Webb:And so the winged teal being the more historically fixed migrators, very reliable in terms of their timing, where Northern Penthale Mallards having a bit more flexibility and responding more to perhaps environment. So it allowed us to look at along that gradient of really intrinsic factors that drive migration.
Mike Brasher:You know, Elliot, one of the other things that I mentioned is the unique aspect of of this study is that we partitioned well, number one, it it used only band recovery data. We we did not use the parts collection, the wing submissions for this, I say this study, this analysis and this manuscript. We subdivided each of those species into, you know, different breeding subpopulations, and I'm gonna show a map to to kinda give some context to that. So I've got this here, this image from from the manuscript, from the article itself. And so we had three subpopulations, if you will, for each of those species.
Mike Brasher:Although we didn't we ended up not there weren't enough pintails or blue wings banded in what we referred to as that Upper Mississippi River, Great Lakes, and Ontario region, so we only did mallards for that region. But for the Western Boreal and prairie habitat, that was one sub geography, and the Northern Great Plains and The US Prairies, that was another sub geography. And so then we just sort of compartmentalized or subset the data based on where the birds whose bands were recovered had been banded. So we're kinda treating those as different subpopulations to see if there were any differences in distribution based on where these birds come from, and that turned out to be a very useful thing to do, as we'll show whenever we get into this. And this is actually an example of a study and a question where Ducks Unlimited has worked with our partners to to try to get this information, these findings in front of our core constituents, our Ducks Unlimited members, our hunting community, because we know it's a question of interest to them.
Mike Brasher:We published we've published several articles in our Ducks Unlimited magazine on this topic. Lisa has contributed to a couple of those. Heath and Lisa and Bram and and I contributed to an article not too long ago, maybe last year, maybe it was 2025, highlighting the results of this very study. We have a webpage that I'll show in a minute where we look at the maps to visualize these changes that we can talk about. So we recognize the importance and interest in this information, and we are trying to get it into the hands of our members and the people that care about it.
Mike Brasher:So I say that just because I also push back a little bit on people when they say you're not interested in this interested in these questions. You're not you don't talk about these things, you know, and that's just not true. We do, and we try to put it out there in a way that that people can access. So I can get a little bit sensitive on some of this stuff if you can't tell. So, yeah, tell us tell me where you wanna go now, Elliot.
Elliot Snider:Well, did did we did we break down the three different species and and exactly what we saw with that study versus the 15?
Mike Brasher:We did not. We did not. And I Well,
Elliot Snider:I think we should I think we should do that.
Mike Brasher:Let me I wanna I wanna bring up the I think the maps will be useful for that. If I can get to that, going back and forth.
Elliot Snider:And while you're doing that, I did why did you not use the wing data for the second one?
Lisa Webb:Because I think the the wing data had it was at the county level, and so we didn't know where in a county it had been collected. So for the first paper, we used just the the center of the county as the the lat long. But this required a more precise data location that we could only get through the the band and copy data.
Mike Brasher:So we now have this is, again, where you wanna be watching video. Be careful. You know, don't watch video while you're driving, you know, all that type stuff. But we have a page on the Ducks Unlimited website. If you go to ducks.org and search for Are Duck Migrations Changing?
Mike Brasher:You will find this page. It has some introduction, sorta orient you to the study. It talks about the three subpopulations that we partition these band recoveries into, sort of originating from, Canadian Prairies, Western Boreal, US Prairies, Great Lakes, and Ontario. And then we have a series of maps corresponding to the three different species. Now, for this website, we only included, I think the maps that we're showing here are January, because they were very sort of emblematic of the primary, of the strongest signal that we detected, which was that northward shift, northward change in band recovery distribution for these, and this map right here does a great job sort of depicting the metrics that we use to characterize those changes in distribution.
Elliot Snider:What are the red and black dots
Mike Brasher:in there, Yep. There's some things to unpack here. So the red and the black dots are the centroid. That's like the average location, the average recovery location for all the bands that feed this particular map. The red dot corresponds to the period of 2010 through 2019.
Mike Brasher:The black dot corresponds to the period 1960 through '69. So we're asking the question, does the average recovery location of banded mallards from the Canadian Prairie and Western Boreal subpopulation that were recovered in January differ between those two time periods, and so it's a lot to piece together there. You gotta stare at this a little bit because we're trying to break down this information in in different pieces. And and so what you see there, the red dot is north of the black dot, which means from 1960 to twenty ten, twenty nineteen, there was a a change to the north in the average recovery location of mallards that originated from the Canadian Prairie and Western Boreal. The distance of change, let me see if I can figure this out here, I think was 143 to five fourteen kilometers north, that's sort of the range, which kilometers, I realize, is a horrible thing to be talking about here.
Mike Brasher:You're probably looking at about 90
Elliot Snider:And that range does not extend into Louisiana at all.
Mike Brasher:Well, okay, so that's the other thing that we're showing here on this map. The green area and the gray area is what we call the core distribution of recovery. That's where you you tell this program to draw a circle or draw a polygon around the region that accounts for the densest 50% of recoveries for this kind of combination, for the Canadian Prairie Western Boreal population in January for those two time periods. And so you can see that core distribution from 1960 to '69 did extend down into Louisiana. It has contracted completely out of Louisiana for the period 2010 through 2019.
Mike Brasher:That's what I think that probably provoked the comment, thank you for telling us what we already knew. But again, we're in the business of documenting this rigorously, putting numbers to this, quantifying it so that we can speak clearly and confidently to what is actually happening at appropriately large scales or what is our whatever is appropriate for informing a discussion.
Elliot Snider:Well, let me add into that, Mike, also on this, what we didn't know because the common themes that are being claimed is that distribution would be clear up in Missouri, and it's not. And
Mike Brasher:For January. For for January. I I would have to pull up the I'd have to pull up the December recovery map, and I have that somewhere, and we can do that.
Elliot Snider:But those are the type of details that a that a study can show versus just like, well, we know they're not going to you know, we can actually find out specifics and and put numbers to it. Yeah.
Lisa Webb:Hey, Mike.
Mike Brasher:Yep.
Lisa Webb:So I think what's illuminating here is this is for the which subpopulation is this? This is the
Mike Brasher:The Canadian prairie and
Lisa Webb:western These are the birds that were banded in Canadian prairies and the Western Boreal. If you look at the other two subpopulations of mallards, the ones that are banded in Prairie US or the Upper Mists, those birds that gray area shows where they historically wintered. Those birds were never going down to Louisiana. This is
Elliot Snider:And where where where area So this one this this map we're looking at now, which which subpopulation is it?
Mike Brasher:US Prairie, yeah, US Prairie subpopulation.
Elliot Snider:So the US Prairie subpopulation never really traveled much into Louisiana. It was the one farther north of it that Well,
Mike Brasher:So so let me look at this right here. So here's the other way you can look at this. So we have that core distribution, then there's the overall distribution. The overall distribution is asking this program to say, draw a polygon, draw, you know, an amorphous circle around the area that accounts for the densest concentration of, I think it's 95% of the of the band recoveries for this particular combination of dates and species and populations, etcetera. For that, you see that it did extend down into Louisiana.
Mike Brasher:It should be truncated to the boundary of the Gulf, so, you know, just ignore the idea that there were mallards harvested 150 miles off the coast of Louisiana there. That's just sort of an artifact of the analysis. But for this, it sort of demonstrates different ways that you can look at it, Elliott, and that's the additional type of information that we wanted to bring to this. Our colleagues from Canada actually used a similar approach. They used, I think, the 50% distribution, maybe the 70% and then the 90%.
Mike Brasher:I can't remember. Do we use the 90 or the ninety fifth? Lisa, Heath?
Heath Hagy:Ninety fifth.
Lisa Webb:Ninety fifth.
Mike Brasher:Okay. So that's gonna be more encompassing. So a 100% would be draw draw a boundary around the area that accounts for 100% of the band recoveries. So it's just a statistical method that allows you identify different areas of concentration. So this one here probably catches your attention.
Mike Brasher:We're back up to Canadian Prairie Western Boreal. One of the other common things that you hear these days, Elliot, is, oh, the migration has shifted west. Right? So this, you can look at this and say, alright. Well, maybe there's some maybe there's some truth to that for some populations.
Mike Brasher:For this Canadian Prairie and Western Boreal subpopulations, it would suggest that in January, there are now, in recent times, more birds being harvested in that sort of Central Plains area than there were in the 1960s, and you also see the black dot and the red dot. Red dot indicates that as well. You've seen a bit of that northwestward shift, but I'm gonna go back down here to The US Prairie subpopulation, and you don't really see that. It's just an overall northward shift both in the centroid as well as the overall extent of that distribution. So that's why we say, and Heath has said multiple times, it's complicated, it depends, and that was one of the key questions that I think going into this, the three of us, four of us including Bram sort of suspected was was most intriguing.
Mike Brasher:That was the thing that we were most intriguing to try to figure out is like how nuanced is this issue? Can we make blanket statements about distributions of ducks and how they've changed over time? And you really can't because it matters depending on which species. It matters depending on which month. It matters depending on which subpopulation of birds you're looking at.
Mike Brasher:And that was one of the coolest things to kinda come out of this, and to further amplify that, we're gonna go now to the Great Lakes and Ontario subpopulation, which showed a totally different sorta outcome. And here on the screen, we're looking at this core 50% distribution. You see the centroid. The black is 19. The red is the 20 teens.
Mike Brasher:It's a northeastward shift, a fairly substantial northeastward shift. You see also a fairly substantial northeastward shift of of that of the core distribution. If you look at the overall distribution, you again sort of see that movement to the Northeast up into more of the Great Lakes and the Midwest, the the sort of Eastern I mean, yeah, Midwest can be a a vague term, I guess, but up into the Great Lakes region. But but it contracts out of Louisiana again, so it's consistent with some of what hunters in in that state have seen. Again, not trying to hide any of this.
Mike Brasher:We're trying to bring good data to these important questions, and and and this is what we're finding.
Elliot Snider:And people can access these maps on the DU website. This is public?
Mike Brasher:Absolutely. It has. It's been out there for, well, for a year or so. It corresponds to these other maps here relate to blue wings and pintails. It it corresponds to this article, Understanding Waterfowl, Ducks on the Move.
Mike Brasher:The authors are the people that you are talking to here, plus our colleague, Doctor. Bram Verhagen, you know, where we talked about this study, and we we went further than what we typically do. We built out this special interactive website where people can explore these maps because it's an important question. We wanna provide reliable information. We want people to learn and be informed.
Elliot Snider:So can we talk causation a little bit or at least I know that I know that wasn't the study with like, there's no set findings, but could we at least talk possibilities?
Mike Brasher:Go ahead. Talk pintails first?
Elliot Snider:Oh, yeah. I'm dying to get to causation, but, yes, I do wanna talk pintails. Everyone listening is with me that they wanna talk causation, but, yes.
Mike Brasher:Oh, okay. So the this will be quick. So remember, we didn't do pintails for the Great Lakes, Upper, and Ontario. The pattern is similar. Pintails are prominent, historically prominent on the Gulf Coast of Texas and Louisiana.
Mike Brasher:We have seen and documented a pretty substantial shift out of that that Gulf Coast area where a higher percentage of pintails are now harvested in sort of the Mississippi Alluvial Valley and other places north. Same pattern sorta holds when you look at the overall distribution, except the area over which this 95% of all recoveries is now harvested is much bigger than what it used to be. That's the other thing that we've kinda seen is an expansion of the distribution of these recoveries at that larger level. And then consistent with what our Canadian colleagues found, blue wing, the pattern of recovery of blue wings, I think we're looking at December here, didn't change a whole lot other than harvest of blue wings in December expanded in, you know, across area. The the distribution historically was primarily in Louisiana, Southeastern Texas, but that distribution has now expanded for December bluing harvest, including North Louisiana and the Mississippi and Arkansas.
Mike Brasher:I think we see that with both of these. Not as much of a change for that that
Elliot Snider:Do you have the October chart for the blue wings? I'd be really curious
Mike Brasher:to see somewhere. I have to I have to dig a little bit for that. So you wanna talk causation. So Heath and Lisa, what are we able to say? I mean, we can we opine about some potential causal mechanism, and we can we can certainly lay out all these things that are hypotheses.
Mike Brasher:So who wants to start with that? Like, when you think about discussion for each of our first two papers, we we can certainly talk about that.
Heath Hagy:This is challenging. Right? And we still have a we still have a paper that that really dives into this in in peer review, so I'll I'll I'll go easy and not wade into that. Let, let maybe Lisa or Mike wade into that a little bit. Elliot, I know you're you're dying, and you're probably thinking about changes in agriculture, changing changes in habitat, right, on the on the Gulf Coast or in in Texas, thinking about changes in in rice fields and aquaculture and sugarcane production and all all of these things, you know, pile up throughout the flyways.
Heath Hagy:You know, I I'll I'll say, just speaking for myself, you know, there isn't one thing. There isn't one thing, one big red button, a lever we can pull to say if we could fix this, we attribute, you know, 95% of it to this change. We can we can understand it. We can attribute it to that thing, and and and we can adjust that if we so wanted to or if somebody so wanted to. And that's frustrating.
Heath Hagy:That's frustrating for us. It's frustrating for waterfowl hunters to hear that. So I just wanna acknowledge that that's a that's a that's a real limitation of of of this process is that we we we didn't find one thing. But there were there were some trends, and and maybe Lisa can talk about some of these things. There there were some some signals that some land use practices were associated with some of these changes.
Heath Hagy:There were some signals that potential habitat things like temperature changes and water changes with precipitation over time and where those and and our ability to detect that. That's another, again, challenge is our ability to detect that perfectly and sort of view it from the lens of of those individual birds and how they'll how they'll change and then have that have that go to harvest. And so there are a few signals from land use. There are a few signals from, from from, precipitation and temperature and other sort of habitat adjacent, variables that that we can point to. I'll probably stay out of the weeds and see if Lisa wants to go into any of those in in particular.
Lisa Webb:I mean, we talk about some of the potential mechanisms or causes for for these distribution shifts in in the second paper that we did and acknowledge that it's likely a variety of factors and and not just one. Some of the ideas that we throw out and or that we consider or hypothesize that are driving these distribution changes are, you know, sort of long term changes in climate, in in winter weather, especially temperatures that could lead to more favorable have winter habitat conditions, the availability of of open water further north, the the decrease in number of days below freezing that that keeps water open and makes it possible for birds to persist there and continue to forage there is one potential explanation and one that we we look at in this next paper. But concurrently, there's been a lot of northward expansion of agricultural commodities into including corn, rice, and other grain crops, a lot of which are consumed by some species of dabbling ducks. And so don't wanna we looked at that as well in terms of amount of agriculture and broadly land use change down the landscape and how that might influence waterfowl distributions.
Lisa Webb:And then just as you can't it's it's probably, you know, not just one thing. There's the potential for for these two factors to interact. That's in a in a warm year, if there hasn't been a wet year, birds birds could stay because of the temperatures. But if there's no water to keep them there, then they might not. And or if there's lots of food available in the landscape, but but it's a drought year, are they going to stay?
Lisa Webb:Or even if there's a lot of food, if it's frozen over, are they going to stay? And so we we, in this next paper, look at the interaction of land use change and weather in terms of determining or influencing duck distributions. How's that for tune in next
Elliot Snider:year for How how specific in in in the paper that's in peer review, how specific do you get with the weather? Is there enough data to go year by year and correlate weather for a particular year and how far south ducks go and just go a year by year? Is there enough data to be able to do that?
Lisa Webb:There are enough data to do that. Where it gets complicated is that we have to generalize over an entire flyway and an entire you know, we have to say what the time period is. And in this case, we looked at distribution changes related to on a monthly time basis. And so how do you summarize weather for an entire flyway and an entire month? And so in it's a trade off in science when you when you try to look over this longer time period and this larger geographic scope that you can't really pinpoint in.
Lisa Webb:The temperature was was this at this day, you know, at this wetland. You've got to generalize across a larger geographic area and and time scale. And so we were able to do that, but it was more at the monthly time scale and at a broader spatial location than maybe Rotland Conservation Area, some of the things people like to look at.
Mike Brasher:Elliot, the reason we have to do that, just to remind people, we're using band recovery data. And so the finer in time that you want to look at a or try to measure a particular pattern, the more you're chopping up that the available data that you have. So if looking at it, if you're making these comparisons across years, the first thing you do is you kind of, you have to chop up the data by individual year, and those recoveries are then spread across a large area for this study site. And then the finer that you wanted to try to measure the distribution of Mallard's, for example, the finer in time that you wanna measure that distribution, you're kinda partitioning that dataset even smaller. And the smaller you partition The finer you partition the dataset, the smaller your sample size for whatever those measurements are, and the larger your variation is going to be, and it's gonna make it even more difficult to find, to detect from a statistical standpoint, any kind of pattern, and on one hand, we say, well, that's unfortunate.
Mike Brasher:On the other hand, we say, well, at some level, the signal isn't strong enough to show itself with a pretty small dataset. So it's a combination of things. It's like the smaller the signal, the more data you need in order to measure it. If you've got a really large signal, signal meaning an actual change, then you should be able to measure that with smaller and smaller amounts of data. But the fact that we're not, and I guess I would just say the complicating factor here is you're dealing with a migratory resource that we're trying to measure across two flyways, the signal just isn't large enough to pull out with a very small piece of data.
Mike Brasher:So it's it's fun with numbers, you know, fun with fun with data, frustrating fun with data.
Elliot Snider:The the fact that the dabbling ducks and the diver ducks are basically showing is it fair to say they're showing essentially the same data between the two? At least on the first study, these changes are across both dabblers and divers.
Mike Brasher:Probably. I mean, at some I I guess I would go back to say it sort of
Elliot Snider:what it looked like from a really charged If
Mike Brasher:you if you back up, if you back way up and are just wanting the 10,000 or 40,000 foot conclusion, it would be that we see trends for changes in distribution, the majority of which suggest a northward change across many different species of ducks. It's strongest in dabblers and strongest in December and January, but then I also go back and think about what we showed you with October and November and how there was not a strong signal for a northward shift during those months. Again Fact,
Elliot Snider:it was a it was a southern shift.
Mike Brasher:That's right. That's right.
Elliot Snider:That's what I'm struggling with. That's here's what I'm struggling with for my own trying to make causation of it, of if it's agricultural practices, that would rule out divers.
Mike Brasher:Well, so
Elliot Snider:So how could it be could it be agricultural? If you're seeing the change in divers too, then agricultural practices wouldn't make a difference. If it's and if it's weather, why would you get a more southern a farther southern migration in October and November unless the weather shows, well, we've actually over this time been a little harsher weather in October and November and a little less severe in December and January. If it's just been a little warmer through the whole way, then you wouldn't see that southern in the first two months and northern in the second two months, which is what makes it difficult for me in my own mind to draw any type of causation.
Heath Hagy:One thing I'll jump in, and I'm not I'm not attributing the changes in diving ducks specifically to any one thing here, so disclaimer. But the changes in the changes in temperature, the changes in rainfall, the changes in agricultural practice, the changes in urbanization, all of these changes, right, are talk about or affect the affect general habitat resources differently. And food I just wanna make sure we think about food is one aspect of the habitat conditions. Does it drive does it drive distributions? Well, maybe at some scale, so maybe at a finer scale or but I'm not sure that there's a ton of evidence at at some massive scale that that food is the only or the, you know, the single most important one.
Heath Hagy:But if you think about diving ducks, right, agriculture may may have impacts to water quality or invasive species. In some areas, we actually have more water, right, on on the landscape because of aquaculture or because of rice production than than we had at some point when it was when it was when it was a different row crop. And so you have the the catfish aquaculture in the Mississippi, you know, Delta is one example of that where we actually had some increases, you know, for diving ducks in a period. So it it's I'm a try not to say it again, but it right? It's complicated, and it's not just about the food.
Heath Hagy:It's about the other things the other things. And then and then I'll I'll back up just to I know that I know that we are on the same page, but just for the listeners, to to really hammer home Mike's point about asking a lot of the data, We we started very broad with some, fair to say, sort of broad questions. We were asking we were asking broad questions of a lot of geography, a lot of species. Every time the question gets more specific, we we need vastly larger amounts of data to answer that. So we started with this large number of species.
Heath Hagy:We stepped it down to a much smaller number of species. The next product steps it down further to I think it's just Mallard's. Correct me if I'm wrong, Lisa, in the in the next one. But because we're asking more of the data and we're asking for much finer resolution, we're beginning to ask what what impacts we see these changes for mallards, for instance. What impacts those at a substate scale as fine as we can get?
Heath Hagy:That is an incredibly data hungry activity to do. And so we have to sort of leave species out, leave out even some questions as we step that down. So I just wanted to make sure we're sort of hopefully, the listeners have kinda put that together, But we've we've as as our questions have gotten more specific and in some cases harder, right, we're getting to harder questions, we have less data available to, to do that, and we really have to crunch that down on those specific species where we deploy a lot of bands and even locations. I I I think we've danced around this one more thing, and I'll stop. But we've danced around this a little bit.
Heath Hagy:I don't know that we've explicitly mentioned how the changes distribution, preseason band distribution, were were incredibly important to take into consideration, and that's why we have the different banding regions. Like, we're talking about birds banded in the in in the Prairies, birds banded in the Upper Great Lakes. The proportion of the number of bands put out has changed dramatically over the years for a bunch of reasons we don't need to go into right now. But but early in the project, Bram was able to help us all understand how important taking that into consideration is. If we just ask this question across species and across banding regions, we would come up with answers that that that were wrong in some cases probably, or we we weren't able to tease out those differences because we have we have to sort of control for the banding region.
Heath Hagy:So sorry. One more thing I had to throw at you, but that's important, and that's why some of the complication was in here because we had to control for that those changes in in banding areas.
Mike Brasher:Elliot, one thing I I've been while Heath was was sharing those details, I was thinking back to your question about, you know, dabblers and divers, and if you look at I think, you know, December and January, those two months are where we saw some of the strongest signals. They're probably also some of the ones that are, I think, most of most interest to folks because those are the months when we would I mean, number one, we if there are changes, those are the months when we would, I think it's fair to say, expect to see those because waterfowl are not obligated necessarily to fly south. I mean, they this is not something that they said, okay. This is our duty to do. We have to fly south this year.
Mike Brasher:Migration is an adaptation to to take advantage of seasonally available resources and to and that basically means it's an adaptation that allows them to move out of areas, northern areas where they breed when those areas get too cold and the wetlands freeze and the food resources decline. It is an adaptation to survive and reproduce. The rate and timing of migration varies based on some of these species. It varies based on what they eat, kinda what they're obligated to eat, how closely they're they're tied to wetlands for feeding. So migration is and changes in migration, I think it's fair to say, stand to be most prominent in those months of December and January when we would've you know, historically, those weather conditions in their northern areas have been most inclement.
Mike Brasher:And so all that to say, to get back to December, January being the most interesting. And to your point, for those two months, for nearly, or maybe it was for every species, we saw northward shifts in their recovery, technically recovery distributions. And to your question, for divers, that can't be an agricultural thing because you don't see redheads, you don't see canvasbacks, you don't see scaup, ringnecks out in agricultural fields flooded or otherwise. And you think about we're probably, to be honest, we're probably missing some of that true distributional shift for some of those species because I know we've all seen photos and videos recently of thousands of redheads packed on on some of those Great Lakes in in December and January when the hunting season is closed. So those signals aren't picked up in banding data.
Mike Brasher:So if anything, we're probably underestimating the northward shift for some of those diving duck species, and it's clearly not an agricultural signal. It's that is clearly going to be a signal tied to to weather and the delayed or nonexistent freezing of some of their feeding habitats. And so if you like waterfowl, this topic is fascinating and frustrating because of all the different things that you have to account for and break it down by species and diet, life history, and distribution, and I guess we were crazy enough to try to tackle some of that.
Elliot Snider:Well, yeah. One more question I was thinking about. With the paper coming out, were you able to study ice cover, ice or snow cover in in the What
Mike Brasher:did we do there? What were the variables that we looked at?
Lisa Webb:I don't think we could do that, but we were able to look at number of frost days. So Okay.
Elliot Snider:Number of
Lisa Webb:days of 32 or below.
Elliot Snider:When when do you have any idea of when that will become public?
Lisa Webb:It's in revisions. So depending on how that goes, if it's, you know, accepted for publication, probably sometime in the next six months available. But if it if they want more extensive revisions, then it then it could be long. Well, I know to be clear on that one, you know, Mike and Heath both talked about the amount of data that's required for this level of analysis in this specific question, we were only able to to look at that for mallards. That was the number of species that we had sufficient, you know, band recovery data for.
Elliot Snider:Well, Mike, do you think there's anything we haven't covered that we should talk about? Or I I don't have any more questions myself.
Mike Brasher:Elliot, I've had fun with this. I've actually had fun kinda going almost two hours and not mentioning not uttering the the one phrase or item that I know a lot of people are wanting us to wanting us to talk about or wondering if we would talk about, and that is, you know, the flooded, unharvested ag you know, agricultural grains, that type stuff. I will say that is something that we just like in in full disclosure, I don't want people to think that we're hiding from that at at all, and and and recognizing that that is a question that people are asking, and I think all of the questions that people are asking deserve some scrutiny and some consideration, and I can tell you that early on, we identified the our interest in trying to be as specific with the characterization of winter waterfowl habitat and the changes in that waterfowl habitat through time when it comes to this idea of causation, and we wanted ideally to be able to partition out the habitats into a lot of different categories. The reality is is that we weren't able to do that. That's just sort of sharing with you a little bit about what is to come in that causation paper just because the data aren't good enough to do that, certainly not for discerning flooded, unharvested agricultural grains.
Mike Brasher:I know there's still some interest in trying to figure that out, and there's some people in our team that are interested in trying to figure that out from the standpoint of helping us understand the condition of our different wintering geographies and their ability to support waterfowl populations. You know, those are important food resources, and we have an interest in that from kind of a conservation standpoint. Our joint ventures have an interest in that, and so we we want and need a a comprehensive understanding of what that that habitat landscape looks like for waterfowl. We tried to get at that, but we were just not able to do so. We even worked with some colleagues briefly who were trying to dial in specifically on identifying those flooded agricultural crops, but they too were not able to tease that out with the available remote sensing at that time.
Mike Brasher:Now with new technology, new sensors, new AI methods, might be able to get at that sometime in the future, but I did at least want to acknowledge that so people could come away from this knowing that it was part of our discussion. We were not able to dial in on waterfowl habitat types with the degree of specificity that we we had hoped to.
Elliot Snider:Well, no, there's being talked about a study to show how much unharvested flooded ag is on the landscape now versus or since 1960. Would that data be helpful in future studies
Mike Brasher:to help If with it's at the right scale, that's the key. If it's at the right spatial and temporal scale, if there's if the classification is confident enough, you can take remotely sensed imagery and do a classification and say, I want to identify this, I want to identify this, and it'll give you an answer. But the key is to have it give you an answer that is accurate enough to draw meaningful inference, you know, to have it actually represent to a high degree of confidence or reasonably high degree of confidence that that is actually what's happening on the landscape. It's not like these people who have tried to do this before can't get some kind of answer. It's that the answer they get is not able to confidently discriminate between different types of vegetation community, just not we haven't been there yet, and so the challenge is gonna be it doesn't really matter what new AI technology or AI models come about.
Mike Brasher:We're still stuck with the same sensors, the same satellite imagery, the same, you know, different bands of detection on these sensors as you go back in time. You can't put up satellites and then go back to 1985 or 1975 and get higher resolution data. I wish we could, but you can't. So people are gonna have to just be aware of that, and and I know there's lots of people that are thinking about these types of things for various purposes. It's easy, relatively easy, to get water from that, but it's much more difficult to differentiate between vegetation communities, and especially if you're trying to differentiate between, like, for example, the question, the item in question, unharvested versus harvested agricultural crops.
Mike Brasher:I'm all for trying to get that answer, but it's very important for us to have some confidence in whatever those results are, and that's what the peer review process is for, to scrutinize those things so we can have some confidence in them if it comes to them feeding into some future analysis of the type that we've that we've discussed here to to measure their effect on causation.
Elliot Snider:Right. Okay. Well, that's that's interesting. I've really enjoyed this conversation. I greatly appreciate you guys involving me in it.
Elliot Snider:It's it's quite honestly, it's an honor to to sit with three experts in the field and even be able to be a part of the conversation at all. So thank you so much. I've I've loved I've loved this conversation.
Mike Brasher:Elliot, we appreciate you you sort of taking the reins, asking the questions, asking the interesting, you know, insights, and pushing us on a few things, and that's what this was for. I think it's I think it's good. I think it's good. So I'll anything from Heath or Lisa?
Heath Hagy:I I can go really quick and and just say how much we appreciate the hunting community asking these questions. This was, you know, in a response to that, not only from a from a from an agency standpoint to try to understand how we do our job better to serve the the hunting community, the bird watching community, the outdoors community. So please keep asking these questions. This was, you know, our attempt to respond to that at the appropriate scale, and it took a while to do that and and to legitimize the question. Right?
Heath Hagy:I I wanna make sure that that that if you have any listeners still with us after a couple hours, we hope maybe a couple of people stayed on here for for this long, that that they hear how much we appreciate sort of engaging in those conversations and and that and that this wasn't an this was not an effort to prove anybody wrong. This was an an effort to understand what we also saw happening, what our data suggested was happening as well. So, hope hopefully, there's still a few people around to to hear that and how much we appreciate that and what an important part of this conversation that the that the the hunting, bird watching community are to to help us better manage our refuges. You know? And I won't speak for for the state agencies, but I know that they have, you know, similar similar aspirations in managing their WMAs and those other public lands.
Heath Hagy:So just wanted to say thank you.
Lisa Webb:Yeah. And I'll say thank you for having us on the the podcast and giving us a chance to talk about the science. It's always fun, but broader, you know, the gratitude in that we wouldn't have been able to do this project without one, who was the postdoctoral research associate on the project, and he led the day to day operations and it was the lead author on on all of these papers. So really appreciate his his contributions and intellectual power behind all of the analyses. And then that we wouldn't have been able to do the study without all the waterfowl vendors and the supporting agencies in both The US and Canada who've done this for over half a century and invested in that data stream that we've been able to use.
Lisa Webb:And then last is as Heath noted, thank you to the hunting community for both asking questions and for turning in band recoveries because this is a community science led effort. We wouldn't have the locations and the timing without the the reporting of those band recoveries. So we appreciate people even, perhaps unknowingly being part of of this data collection.
Elliot Snider:Alright. Well, this has been a collaboration between the North American Waterfowler Podcast and Ducks Unlimited. My name is Elliot. I've been with Mike Brasher, Lisa Webb, and Heath Hagee. Thank you so much for listening.
Elliot Snider:Have a great day.
VO:That's a wrap for today's episode of the Ducks Unlimited Podcast brought to you by Bird Dog Whiskey and Cocktails. From post hunt unwinds to celebrations back at camp, Bird Dog delivers award winning flavor to every moment. Enjoy responsibly. Don't forget to rate, review, and subscribe, and check out ducks.org/dupodcast for more stories, science, and all things waterfowl. Guest opinions are their own and don't necessarily reflect those of Ducks Unlimited.
VO:Until next time, stay fired up, stay focused, and stay tuned to the Ducks.
Creators and Guests